Group Final for GEOG 491 "Park disparity based on income"
I had the oppertunity to work with one of my peers to research if there is a correlation with park access and beyond that quality of parks based on income. I have included the graphics that I made for the project. Group paper is displayed at the bottom of the page.
Maps!
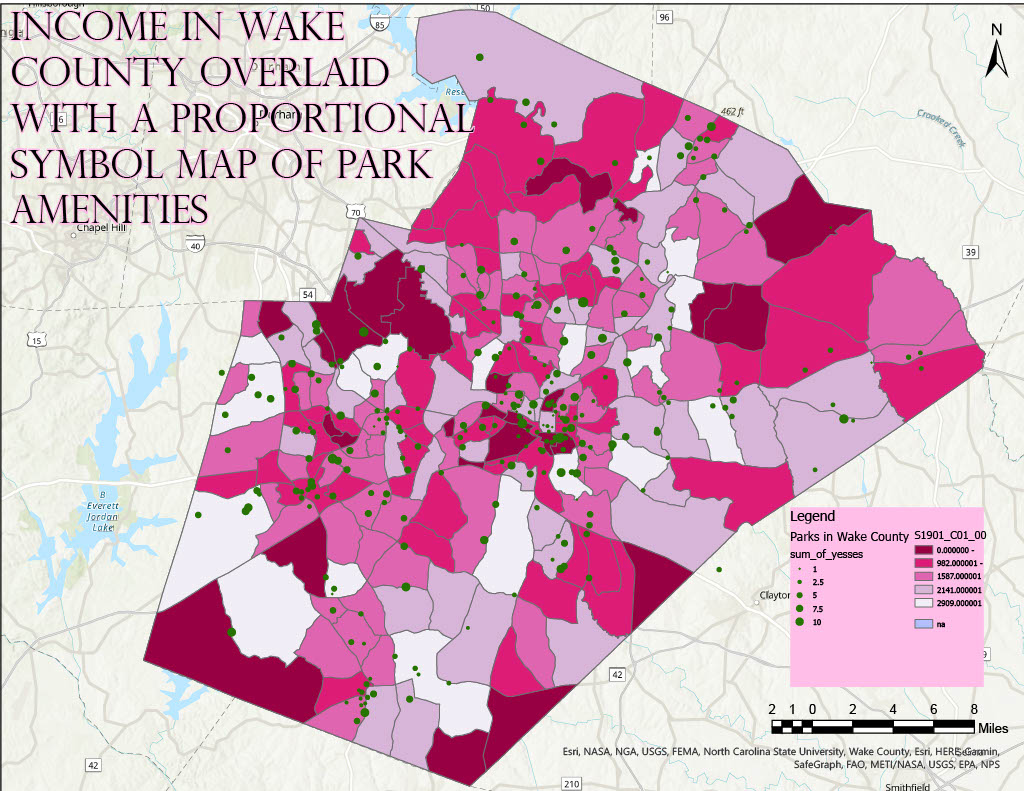
Proportional Symbol map of Park Amenities over an Income choropleth
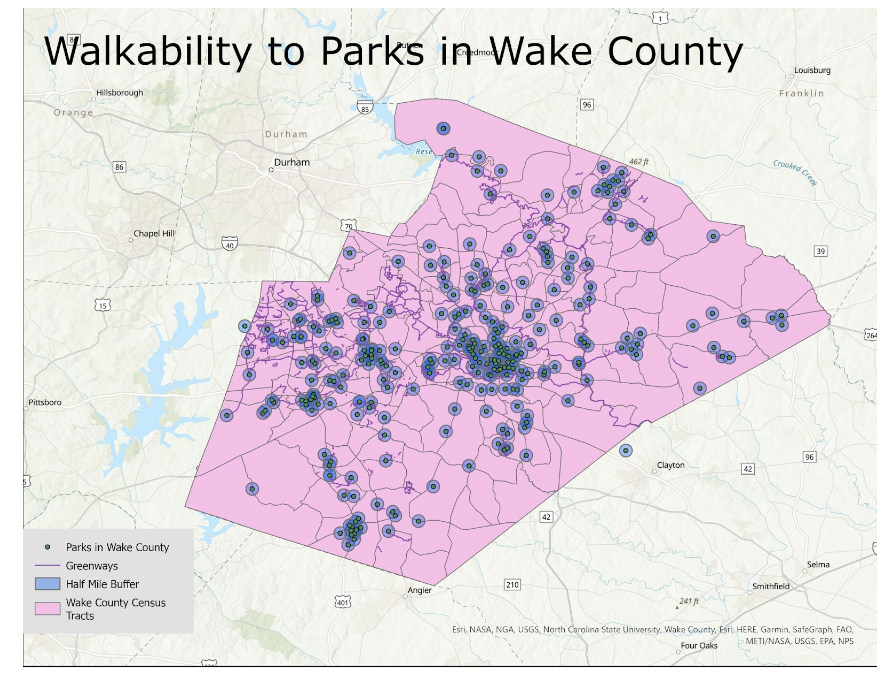
Walkability to maps in Wake County using a half-mile buffer
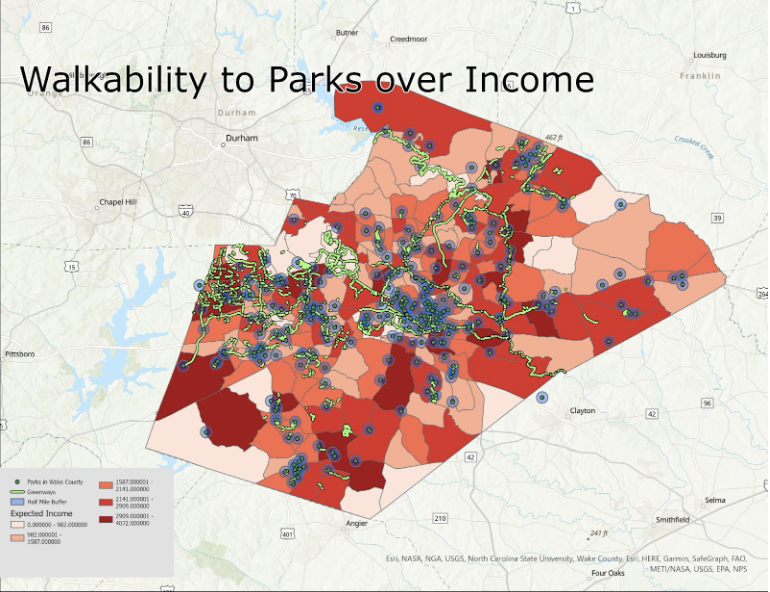
Walkability to maps in Wake County using a half-mile buffer over Income Choropleth
Background info!
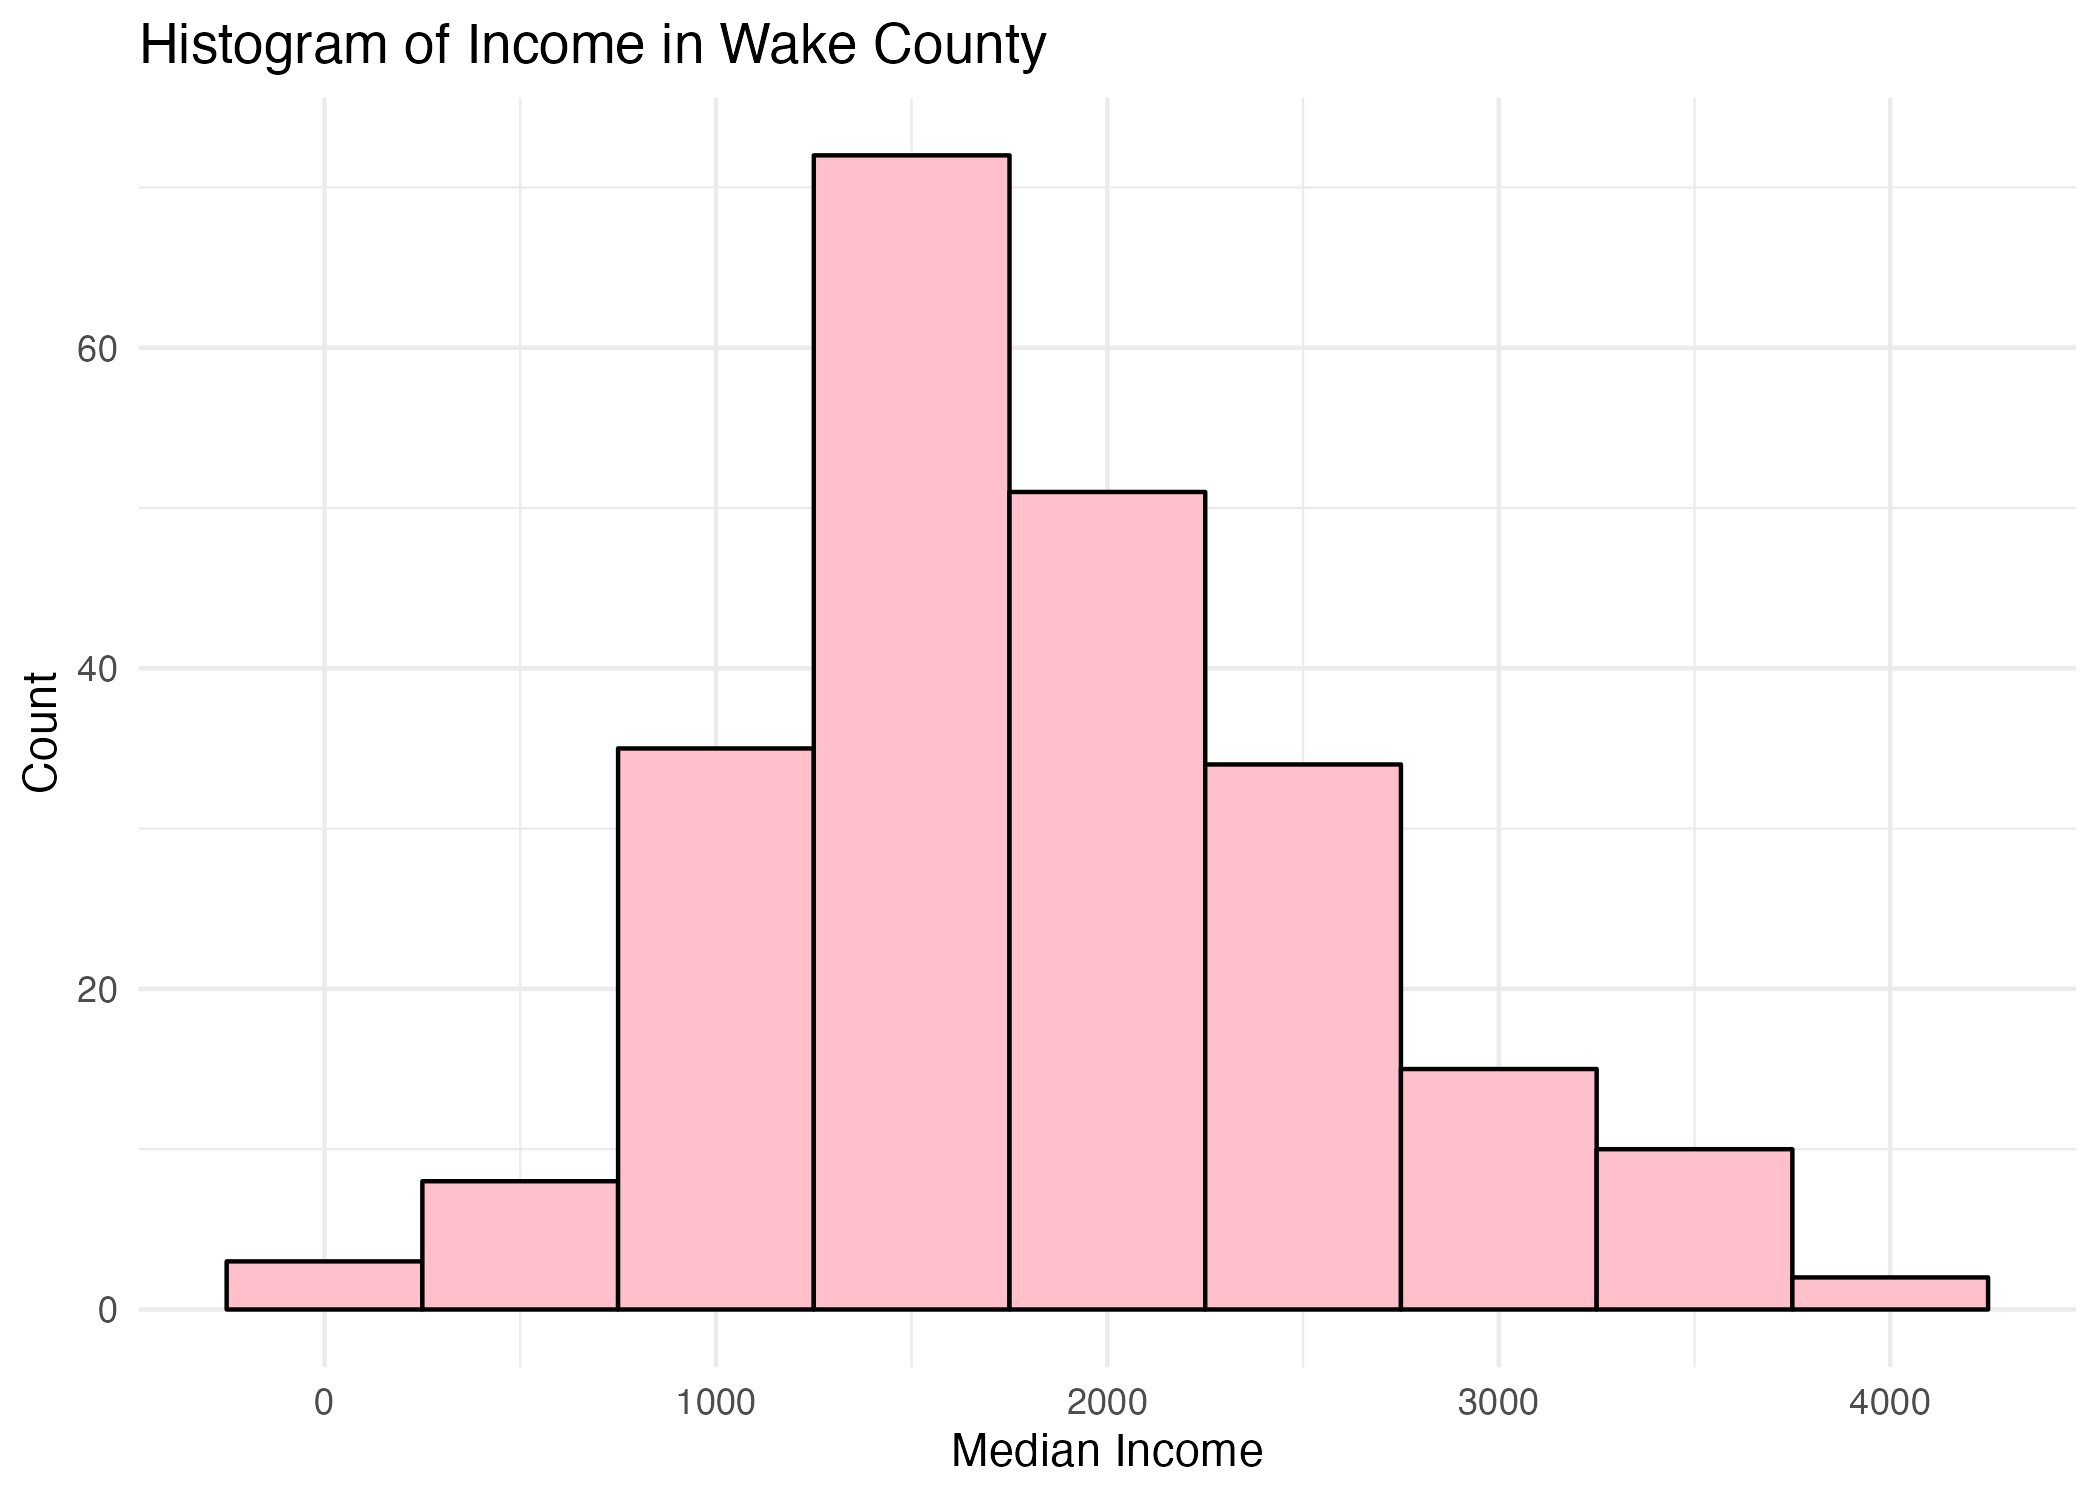
Histogram of incomes in Raleigh made in Rstudio
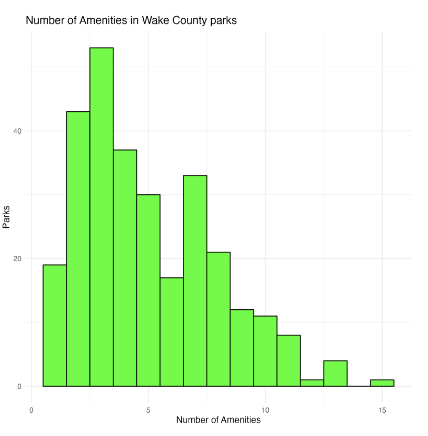
Histogram of Amenities at various parks made in Rstudio by combining all every yes listed to create a numerical representation of the amenities for each park.
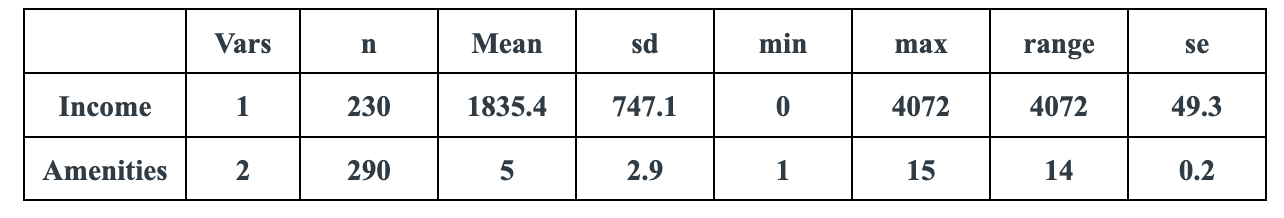
Stats of Income and Amenitiy values in a table format
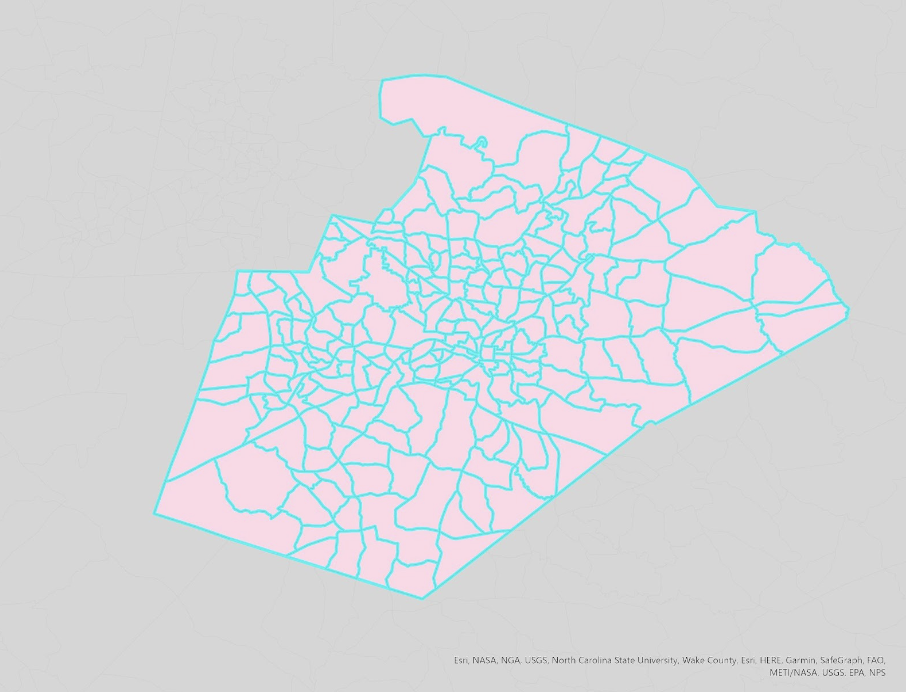
Study area of Raleigh