Geoprocessing Analysis
How do HOLC redlined districts impact fresh food acess?
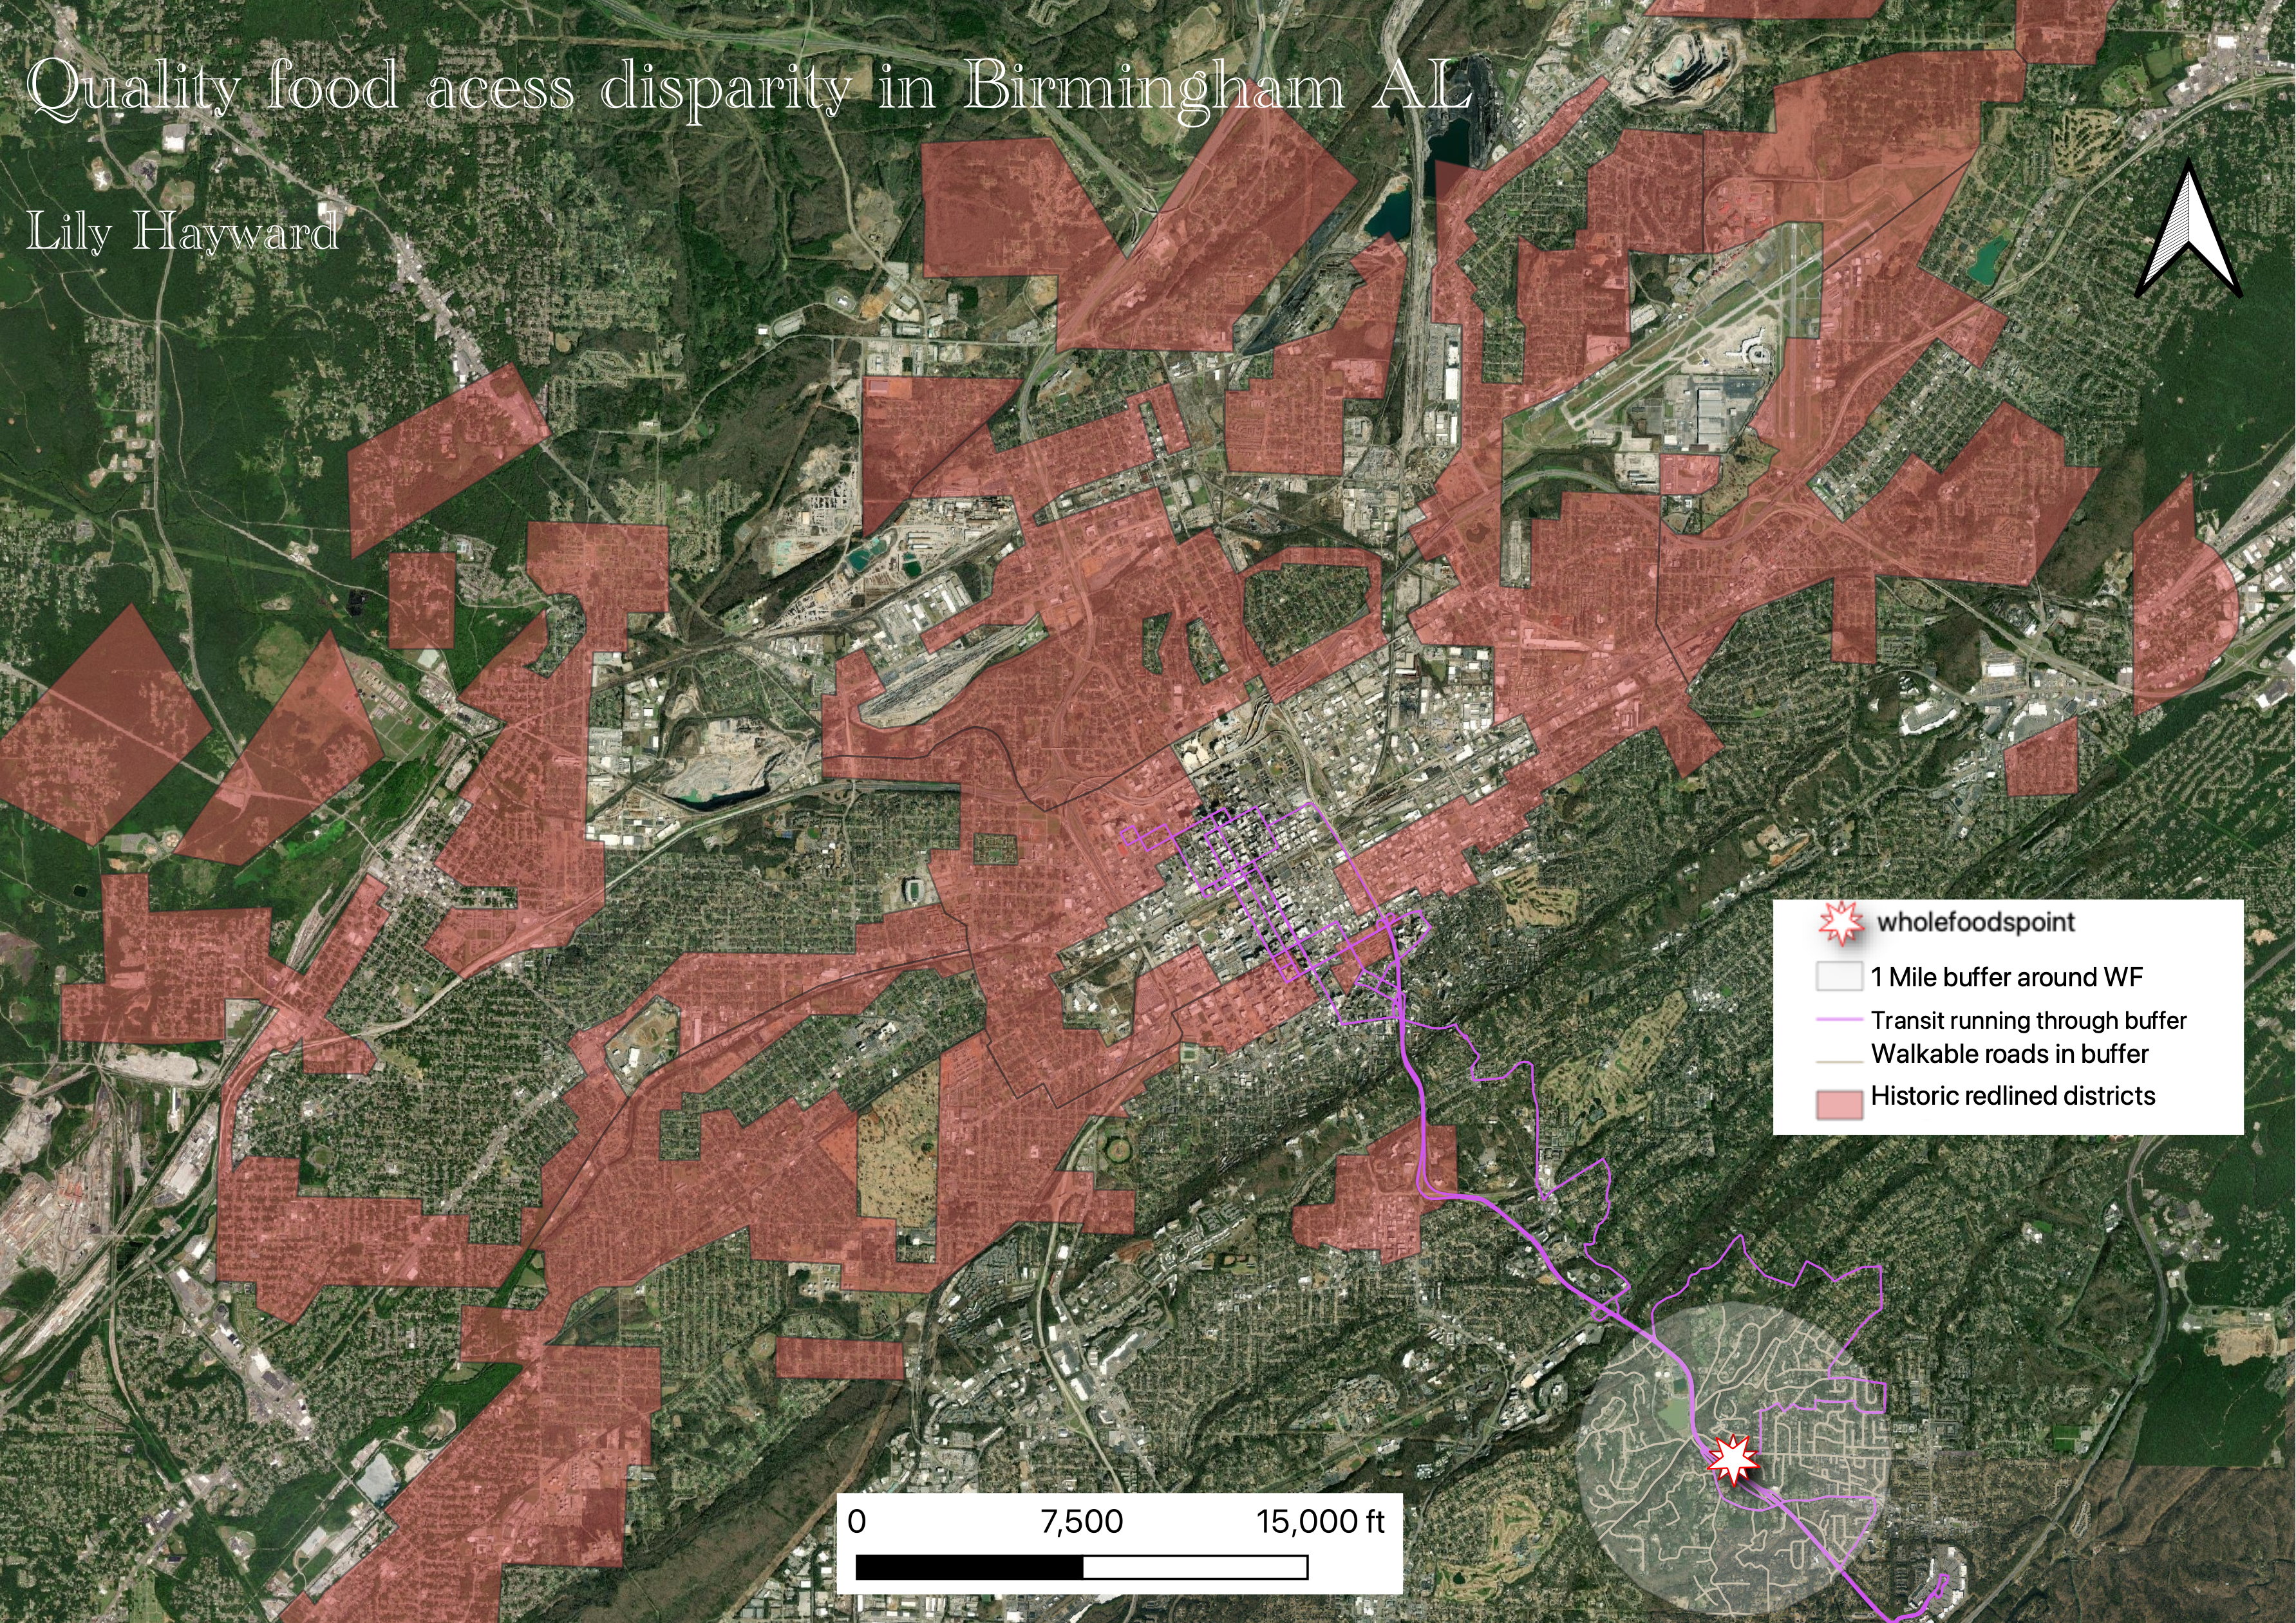
In response to my question I wanted to make a comment on this through picking a grocery store that is often acclaimed for its freshness and quality. There is one location of Whole Foods in Birmingham which allows for better analysis in the transit option of that one place. I used the historic redlined districts which were districts that the Home Owners’ Loan Corporation didn’t give loans to because they would not return them and these were often communities of color. I wanted to see if these communities that were not given loans and therefore weren’t able to gain wealth through property would have access to this specific store that is known for its quality of food. I plotted the one Whole Foods by using the address found online and choosing it on the open street map. I then made a one mile buffer around the Whole Foods that represented a feasible distance to walk to and from Whole Foods. Using tiger file road data I was able to plot the walkable paths then clip it with the buffer. This allows for a visualization of the data. The next thing I used were the transit routes for Birmingham where I selected only things that connected to the Whole Foods buffer as that is how one would get around without access to a car. The map displays the fact that very few districts have direct access to this transit line and it would require much more effort that most people would not put in to get food. Using the buffer and the clip with other methods of filtering data, I am able to show that this Whole Foods is not in a good location for people living in the historically redlined districts to access food.
Data used in this project
Birmingham Transit Routes.
HOLC redlined districts.
Used road zip
Git website where anything labeled wholefoodspoint has to do with it.